Every BD and marketing leader is chasing the same goal: use analytics to unlock growth. Most dashboards are full of KPIs like customer lifetime value, churn rates, and NPS scores. On paper, it looks like you have everything you need. In practice, the picture often feels incomplete. The data is there, but the insights are thin.
Here’s the hard truth: most organizations are not tracking the most important metric of all. Customer intelligence analytics captures the strength of relationships that traditional KPIs overlook.
Your team works hard to report revenue and active engagements. You know what has been billed and what’s under contract. What you don’t know is how strong your relationships are with the people inside that account.
That missing layer is customer intelligence analytics. It shifts the focus from static outcomes to the living network of relationships that actually drive them.
Table of contents
What is customer intelligence analytics? A quick primer
Before we talk about how relationship data changes the game, let’s ground the concept. Customer intelligence analytics is the practice of collecting, combining, and analyzing client data to uncover patterns that guide better decisions. It helps you understand not only what is happening in an account, but also why it’s happening and what’s likely to come next.
At its core, it blends proven analytics methods with customer-centric data sources to provide a clearer view of client needs, project dynamics, and stakeholder engagement.
The 4 types of analytics
To see where this type of intelligence fits, it helps to review the four main types of analytics most organizations use:
- Descriptive analytics: Answers the question, what happened? Example: “This client increased their project scope by 15% last quarter.”
- Diagnostic analytics: Explains why it happened. Example: “Scope expanded because additional stakeholders pushed for new services.”
- Predictive analytics: Forecasts what is likely to happen next. Example: “Based on communication patterns, this client is showing early signs of disengagement.”
- Prescriptive analytics: Recommends what to do about it. Example: “Prioritize executive-level outreach and broaden relationships beyond a single champion to reduce risk.”
Customer intelligence analytics spans all four. It describes past activity, diagnoses the reasons behind it, predicts future risks and opportunities, and prescribes the actions most likely to strengthen the relationship.
Common data sources
In professional services and the built environment, customer intelligence looks different from product-led or consumer businesses. The focus is less on digital footprints, and more on the tangible markers of project and account health. Typical data sources include:
- Transactional data: Contract values, phases of work, change orders, and renewals. These reflect the financial side of the client relationship.
- Engagement records: Project updates, meeting notes, and touchpoint frequency. These show whether a client is engaged and whether your team is keeping pace with expectations.
- Support and issue logs: RFI responses, dispute resolutions, service tickets, and other problem-tracking systems. These provide a view of how quickly and effectively you respond when issues arise.
- Survey and feedback programs (limited use): Some firms run post-project surveys or client listening programs, but many leaders see these as incomplete signals, rather than a true measure of relationship health.
These sources are helpful, but they still miss the bigger picture: the actual breadth and depth of relationships between your teams and the client’s stakeholders. That’s the layer most organizations don’t measure, even though it’s often the deciding factor in whether clients expand, renew, or walk away.
Standard B2B KPIs… and their hidden flaws
On their own, common performance metrics only take you so far. They summarize results after the fact, but they don’t explain the strength of the relationships behind those results. That blind spot leaves leaders reacting to numbers instead of anticipating risks and opportunities.
Customer lifetime value (CLV)
CLV tells you what an account is worth in financial terms, but it doesn’t tell you who inside that account is driving the value. You might know a client is worth $10 million over five years, but you can’t see which stakeholders influence that spend or whether your team has relationships with them. Without that layer, CLV is like knowing the score of the game without knowing how it’s being played.
Churn rate
Churn is one of the most widely tracked KPIs, but it’s also one of the most reactive. It only tells you when you’ve already lost. By the time churn shows up in your dashboard, the client has disengaged, the contract has ended, and the opportunity to repair the relationship is gone. What it doesn’t do is highlight the early signals like declining engagement, fewer touchpoints, narrow relationships that point to risk before it becomes churn.
Net promoter score (NPS)
NPS is often positioned as a proxy for customer sentiment, but it typically reflects the opinion of one or two individuals willing to respond to a survey. In B2B, decisions rarely rest with a single person. An NPS of 9 from one happy champion might mask the fact that ten other stakeholders are frustrated or disengaged. NPS can be a useful signal, but on its own it doesn’t capture the health of the full account relationship.
Even in companies that don’t use NPS, the fallback is often just as thin: celebrating that a partner took one stakeholder to lunch last week or pointing to a strong month of billables as proof of client health. Neither reflects the reality of a multi-stakeholder relationship, where engagement can be uneven and risk can build quietly.
The missing layer: an introduction to relationship analytics
Traditional KPIs tell you what has already happened. Customer intelligence analytics, powered by relationship data, shows you what is happening right now. It’s the missing layer of customer intelligence: measuring not just the outcomes of your work, but the quality of the relationships that drive them.
Analyzing your “dark matter”: emails, meetings, and calendars
Every day, your teams are generating an enormous amount of relationship data. Emails sent, meetings booked, calls logged, follow-ups completed. Most of this never makes it into a CRM. It lives in inboxes and calendars: the “dark matter” of customer engagement. Relationship analytics captures this data automatically, revealing who is talking to whom, how often, and how those patterns shift over time.
Moving from account-level data to human-level insight
Standard KPIs look at the account as a single unit. But accounts don’t make decisions, people do. Relationship analytics drill down to the human level. They can tell you if your team is connected only to one champion while ignoring five other decision-makers, or if engagement is clustered in the middle ranks while executives remain untouched. This shift from account-level abstraction to stakeholder-level clarity is what makes relationship analytics so powerful.
How AI quantifies intangible relationship strength
Relationships may feel intangible, but AI makes them measurable. Proprietary algorithms like that of Introhive can take into account factors like the type of contacts you’re communicating with (for example, level of seniority), how recently and how often those interactions occurred, the regularity of communication over time, and the overall volume of emails and meetings exchanged. In other words: recency, quantity, cadence, and intimacy. Together, these dimensions create an objective picture of relationship health that can be tracked, benchmarked, and acted upon.
5 B2B analytics you can ONLY get from relationships
The real value of customer intelligence analytics shows up in the metrics you cannot get anywhere else. Relationship analytics uncovers signals that never appear in a standard KPI dashboard, yet they often determine whether an account grows, stalls, or walks away.
1. Predictive relationship scoring
This is a leading indicator of account health. By looking at recency, frequency, breadth, and depth of communications, you can see whether relationships are strengthening or slipping. Instead of waiting for churn to show up in revenue numbers, predictive relationship scores flag accounts at risk early, when you still have time to intervene.
2. Team relationship capital
Not all teams build the same depth of relationships. This metric quantifies which groups inside your organization, such as practice areas, service lines, account teams, or project teams, have the strongest connections to top accounts. It highlights hidden influencers within your firm and helps leaders ensure client relationships are broad, not siloed.
Strong external relationships often depend on strong internal collaboration. When colleagues across practices share connections and work together, it opens the door to deeper engagement with clients. McKinsey research shows that team-focused transformations can drive efficiency gains of up to 30 percent when cross-functional collaboration is embraced effectively. That kind of efficiency not only improves delivery but also strengthens the quality of client relationships.
In professional services specifically, research shows that more complex, cross-practice projects lead to higher value: lawyers who worked on multi-practice projects in a given year saw higher hourly rates compared to peers focused on single-practice projects. The more collaborators involved, the greater the uplift.
3. Introduction path analysis
Most business development leaders know that a warm introduction is more powerful than a cold call. Relationship analytics proves it. By analyzing how introductions are made across your network and which ones convert into opportunities, you can identify the paths that consistently deliver results and refine your growth strategy around them.
4. Executive engagement mapping
Big accounts expect senior-level attention. Executive engagement mapping shows whether your leadership is actively connected to your customer’s leadership. If there’s a gap, and your executives aren’t engaging theirs, it’s a clear signal that the account may lack sponsorship at the highest level.
5. Account “white space” analytics
This metric exposes untapped opportunities by showing where your strongest relationships already exist. For example, if one division of a client is highly engaged with your team but other divisions are untouched, that’s white space. Relationship analytics reveals those expansion opportunities and gives your team a relationship-driven roadmap for cross-sell.
How to build a true B2B customer intelligence analytics engine
Building a genuinely intelligent customer engine means going beyond traditional dashboards. It’s about powering your CRM with relationship data, automating contact data maintenance for on-going accuracy and time savings, and turning insights into action. Here’s how it works, step by step.
Step 1: Centralize your data (your CRM)
Start by treating your CRM as the single source of truth. Every customer interaction, contact detail, and activity needs to live here clearly and consistently. That means eliminating silos, fixing stale records, and ensuring your CRM truly reflects your active relationships. An accurate, complete CRM allows you to trust the data you’re working with instead of struggling with fragmented or outdated information.
Step 2: Automate data capture to ensure quality (Introhive’s core function)
This is where Introhive becomes indispensable:
- Introhive’s CRM data automation integrates with your firm’s email and calendar systems to capture and sync contacts, communications, and meetings with no manual input required.
- It uncovers 50–70% more client contacts that typically remain unrecorded, building a far more complete relationship database.
- The platform continuously enriches and cleanses contact information by identifying duplicates, stale records, and missing details so your CRM stays accurate and reliable.
- Whether you’re using Salesforce, Microsoft Dynamics, HubSpot, or another CRM, Introhive works alongside your existing workflows by replacing tedious data entry with automated syncs and digests.
Step 3: Layer on a relationship analytics platform (Introhive’s dashboards)
With clean, comprehensive CRM data in place, the final piece is unlocking actionable intelligence:
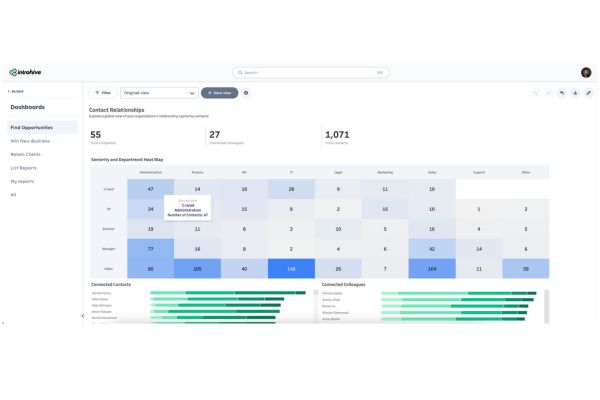
- Introhive delivers powerful relationship intelligence, offering a 360° view of every connection past and present. It helps your teams proactively spot risks, hidden champions, and collaboration gaps.
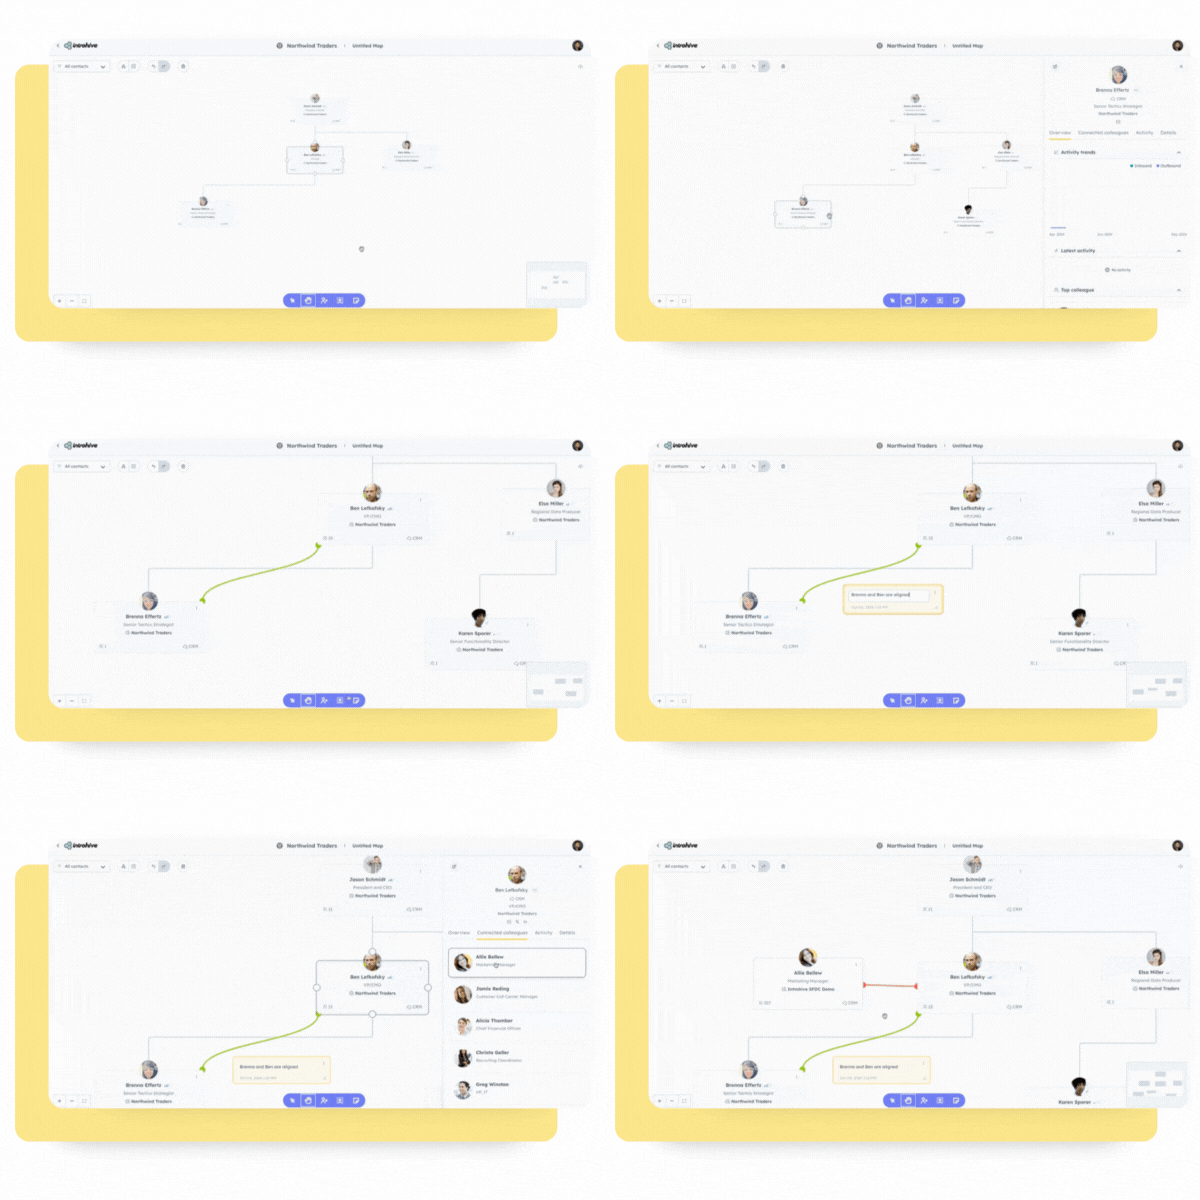
- Relationship maps visualize who knows who, how well, and when they last engaged. This makes it easy to spot breakdowns or opportunities in stakeholder coverage.
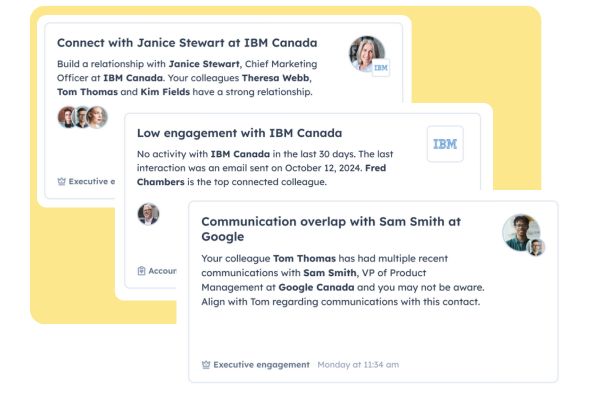
- Tools like Signals trigger real-time alerts for disengagement or shifts in interaction, enabling timely outreach before risks escalate.
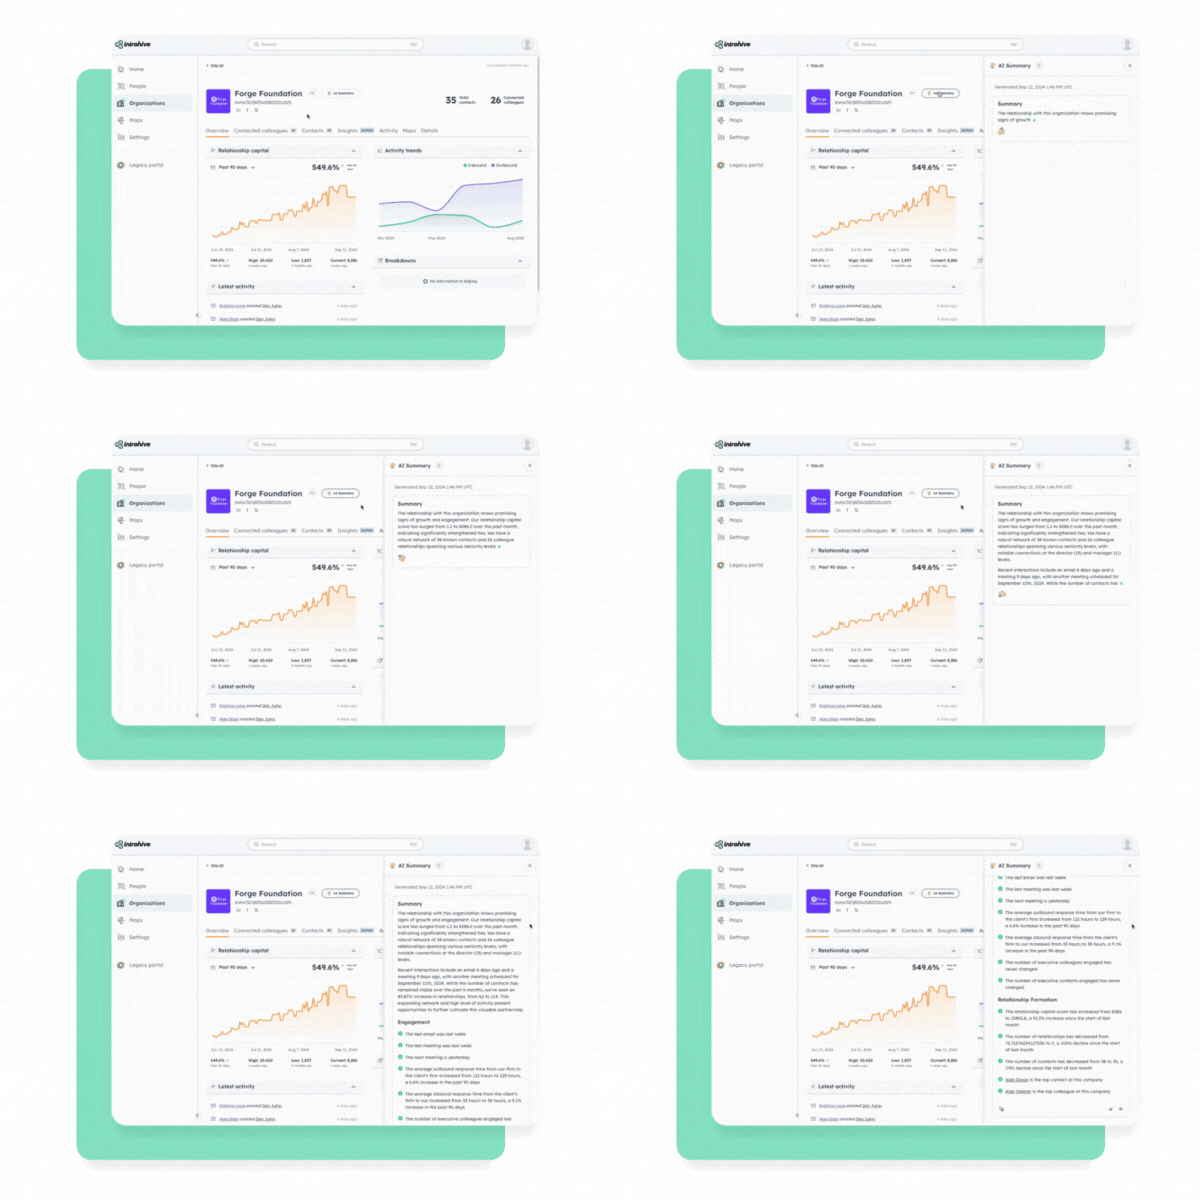
- Introhive’s AI-powered account summaries condense engagement history, relationship depth, and key trends into clear, actionable profiles. Teams get instant clarity on account health and momentum, without hours of manual prep.
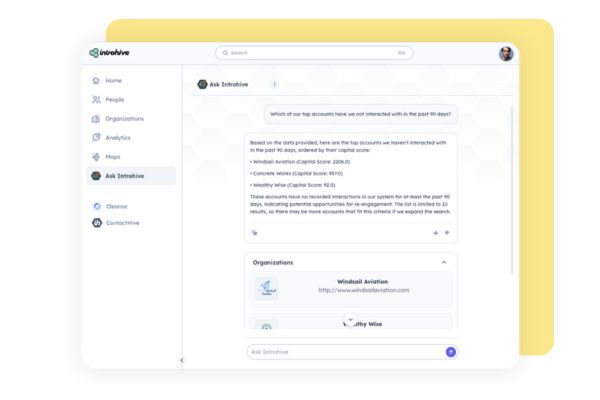
- Ask Introhive is a personal relationship concierge. Ask broad or account-specific questions – like who has the strongest prospect relationship or the latest client updates – and get instant answers to stay informed and ready.
The firms that win in today’s market are the ones that look past surface KPIs and measure the layer most dashboards ignore: relationships. Customer intelligence analytics brings that missing layer into focus, giving you the visibility to strengthen client connections, reduce risk, and uncover growth opportunities already present inside your accounts.
Ready to see how it works? Jump into our interactive demo to experience relationship analytics firsthand.
Better yet, book a demo with our team to explore how Introhive can transform your CRM into a true customer intelligence engine.
BOOK A DEMO


